
Spanish
Deming Collaboration has produced the application XmR, which is a major help to decision makers in their job to improve processes and systems.
SPC (known as Quality Control Charts or Statistical Processes Control Charts) used by Shewhart, Deming and Wheeler, charting X or Xbar and moving ranges. This allows both for full period analysis or to divide them in shorter periods.
New release version 5.0, of February 2013, includes the following functions:
– Xbar & R-chart
– Individual & Moving range Chart
– Histogram – Distribution of results Chart
– Complete range of data and/or divided into sets of series fully automated and friendly use
It works with Excel Microsoft Windows and Mac.
Studying a full period:


Studying a period divided in series:
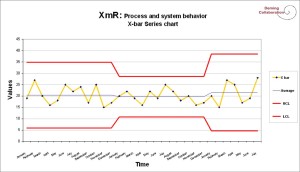
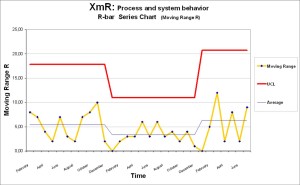
Help in evaluating system and process behaviors is based on:
-
Identifying whether the variation causes belong to the system (systemic, natural, common) or are special causes.
-
Drawing the charts with the system’s noise limits.
-
Studying the process capability Cp, Cpk, Cpm.
Up to 200 individual data
Up to 35 subgroups. From 2 to 10 measurements
– DEMO with user instructions –
For more information contact jordi@demingcollaboration.com