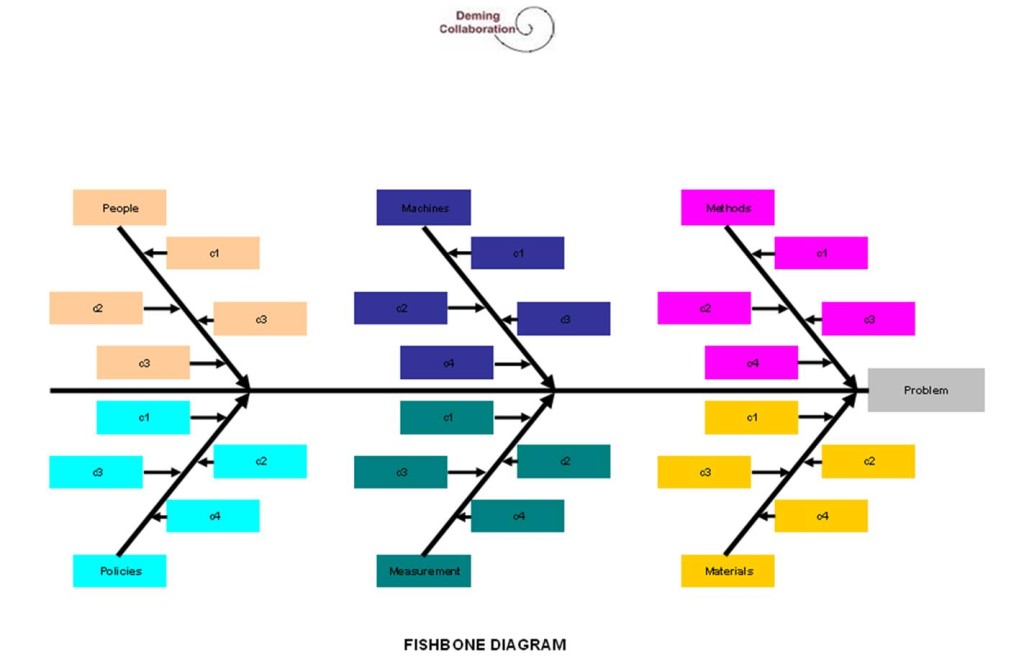
Ishikawa diagrams (also called fishbone diagrams or cause-and-effect diagrams) show the root causes of a specific event or problem.
Frequently causes can be grouped into 9 Categories or “Whys” which later can be detailed in another level:
-
Machines
-
Methods
-
Materials
-
Measurement
-
People
-
Environment
-
Policies
-
Procedures
-
Plant Layout
The application allows customizing by adding new parameters or changing them.
It works both with Windows and Mac.